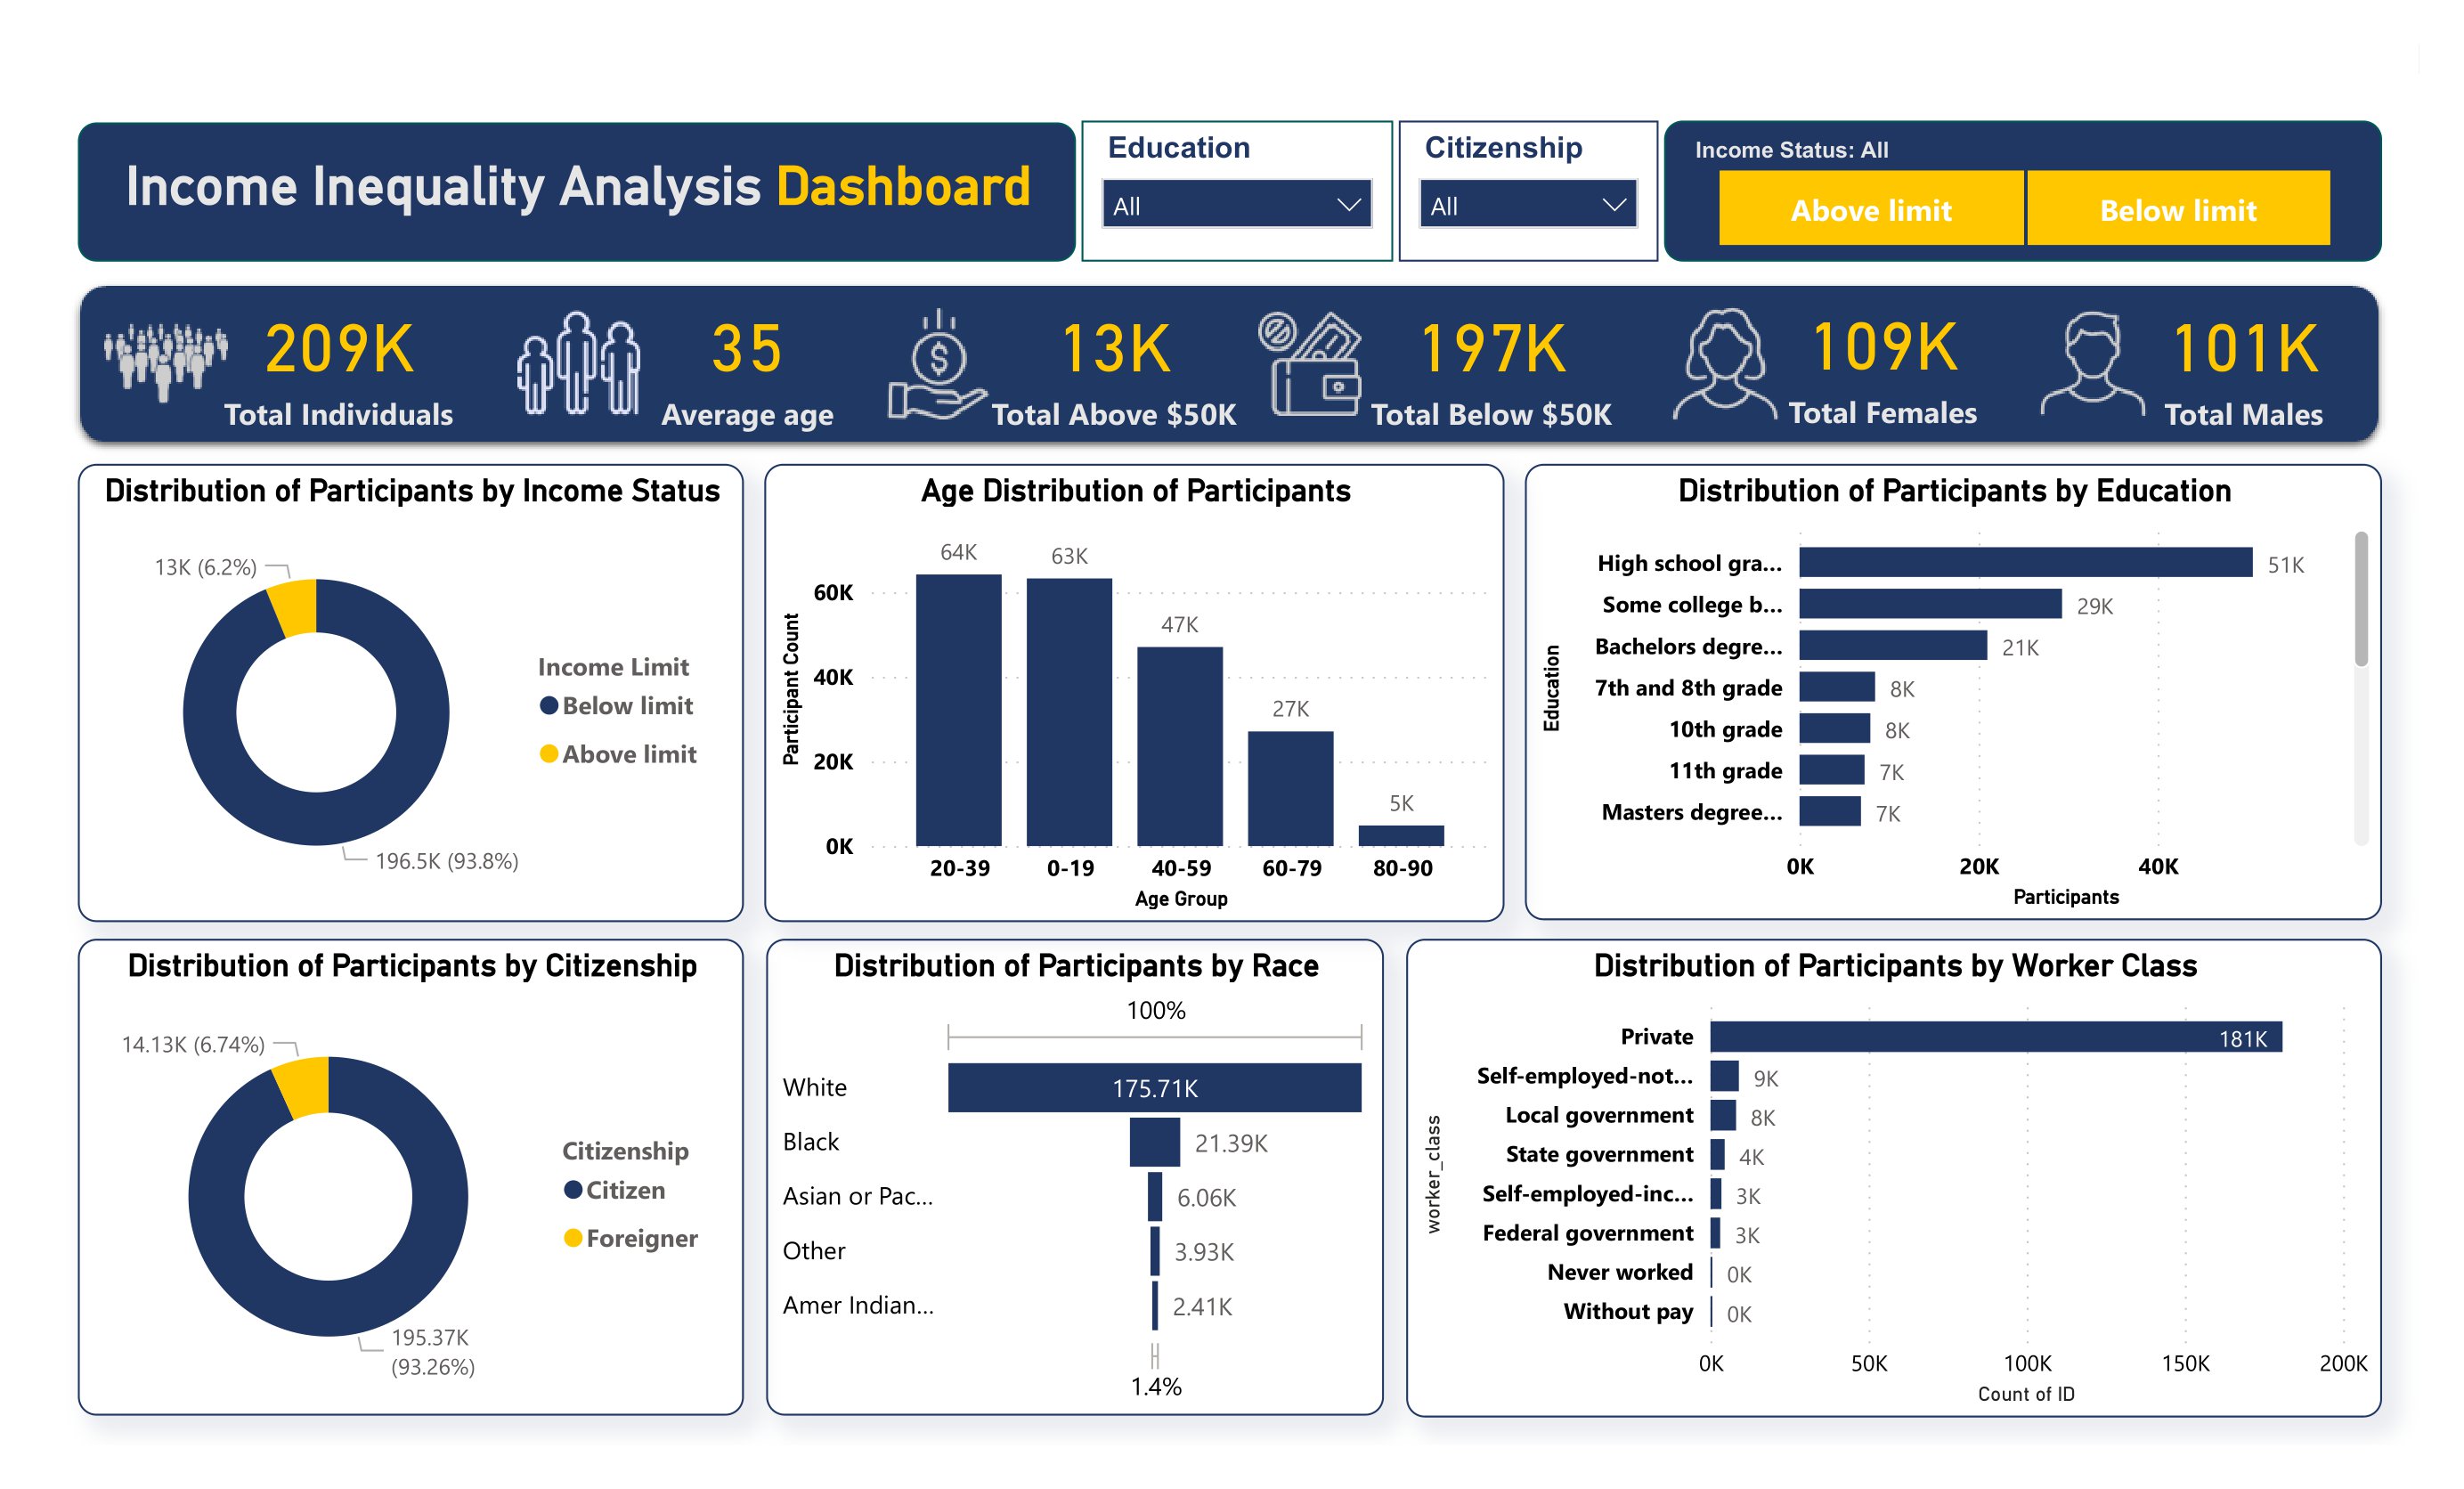
This project involves an in-depth analysis of census data using Power BI to gain insights into income distribution and factors affecting individuals' income levels. The data was sourced from census datasets providing demographic and income-related information. Through Power BI's Power Query, I cleaned the data to ensure dataset quality and conducted exploratory data analysis (EDA) using statistical analysis and data visualization techniques within Power BI. The findings indicate correlations between education levels and income, gender disparities in income thresholds, and income inequality across various employment statuses. Additionally, racial and immigrant populations face income disparities, and specific occupational categories exhibit higher concentrations of individuals below the income threshold. This data-driven analysis underscores the importance of leveraging Power BI for insightful data visualization and analysis to understand income patterns and disparities.
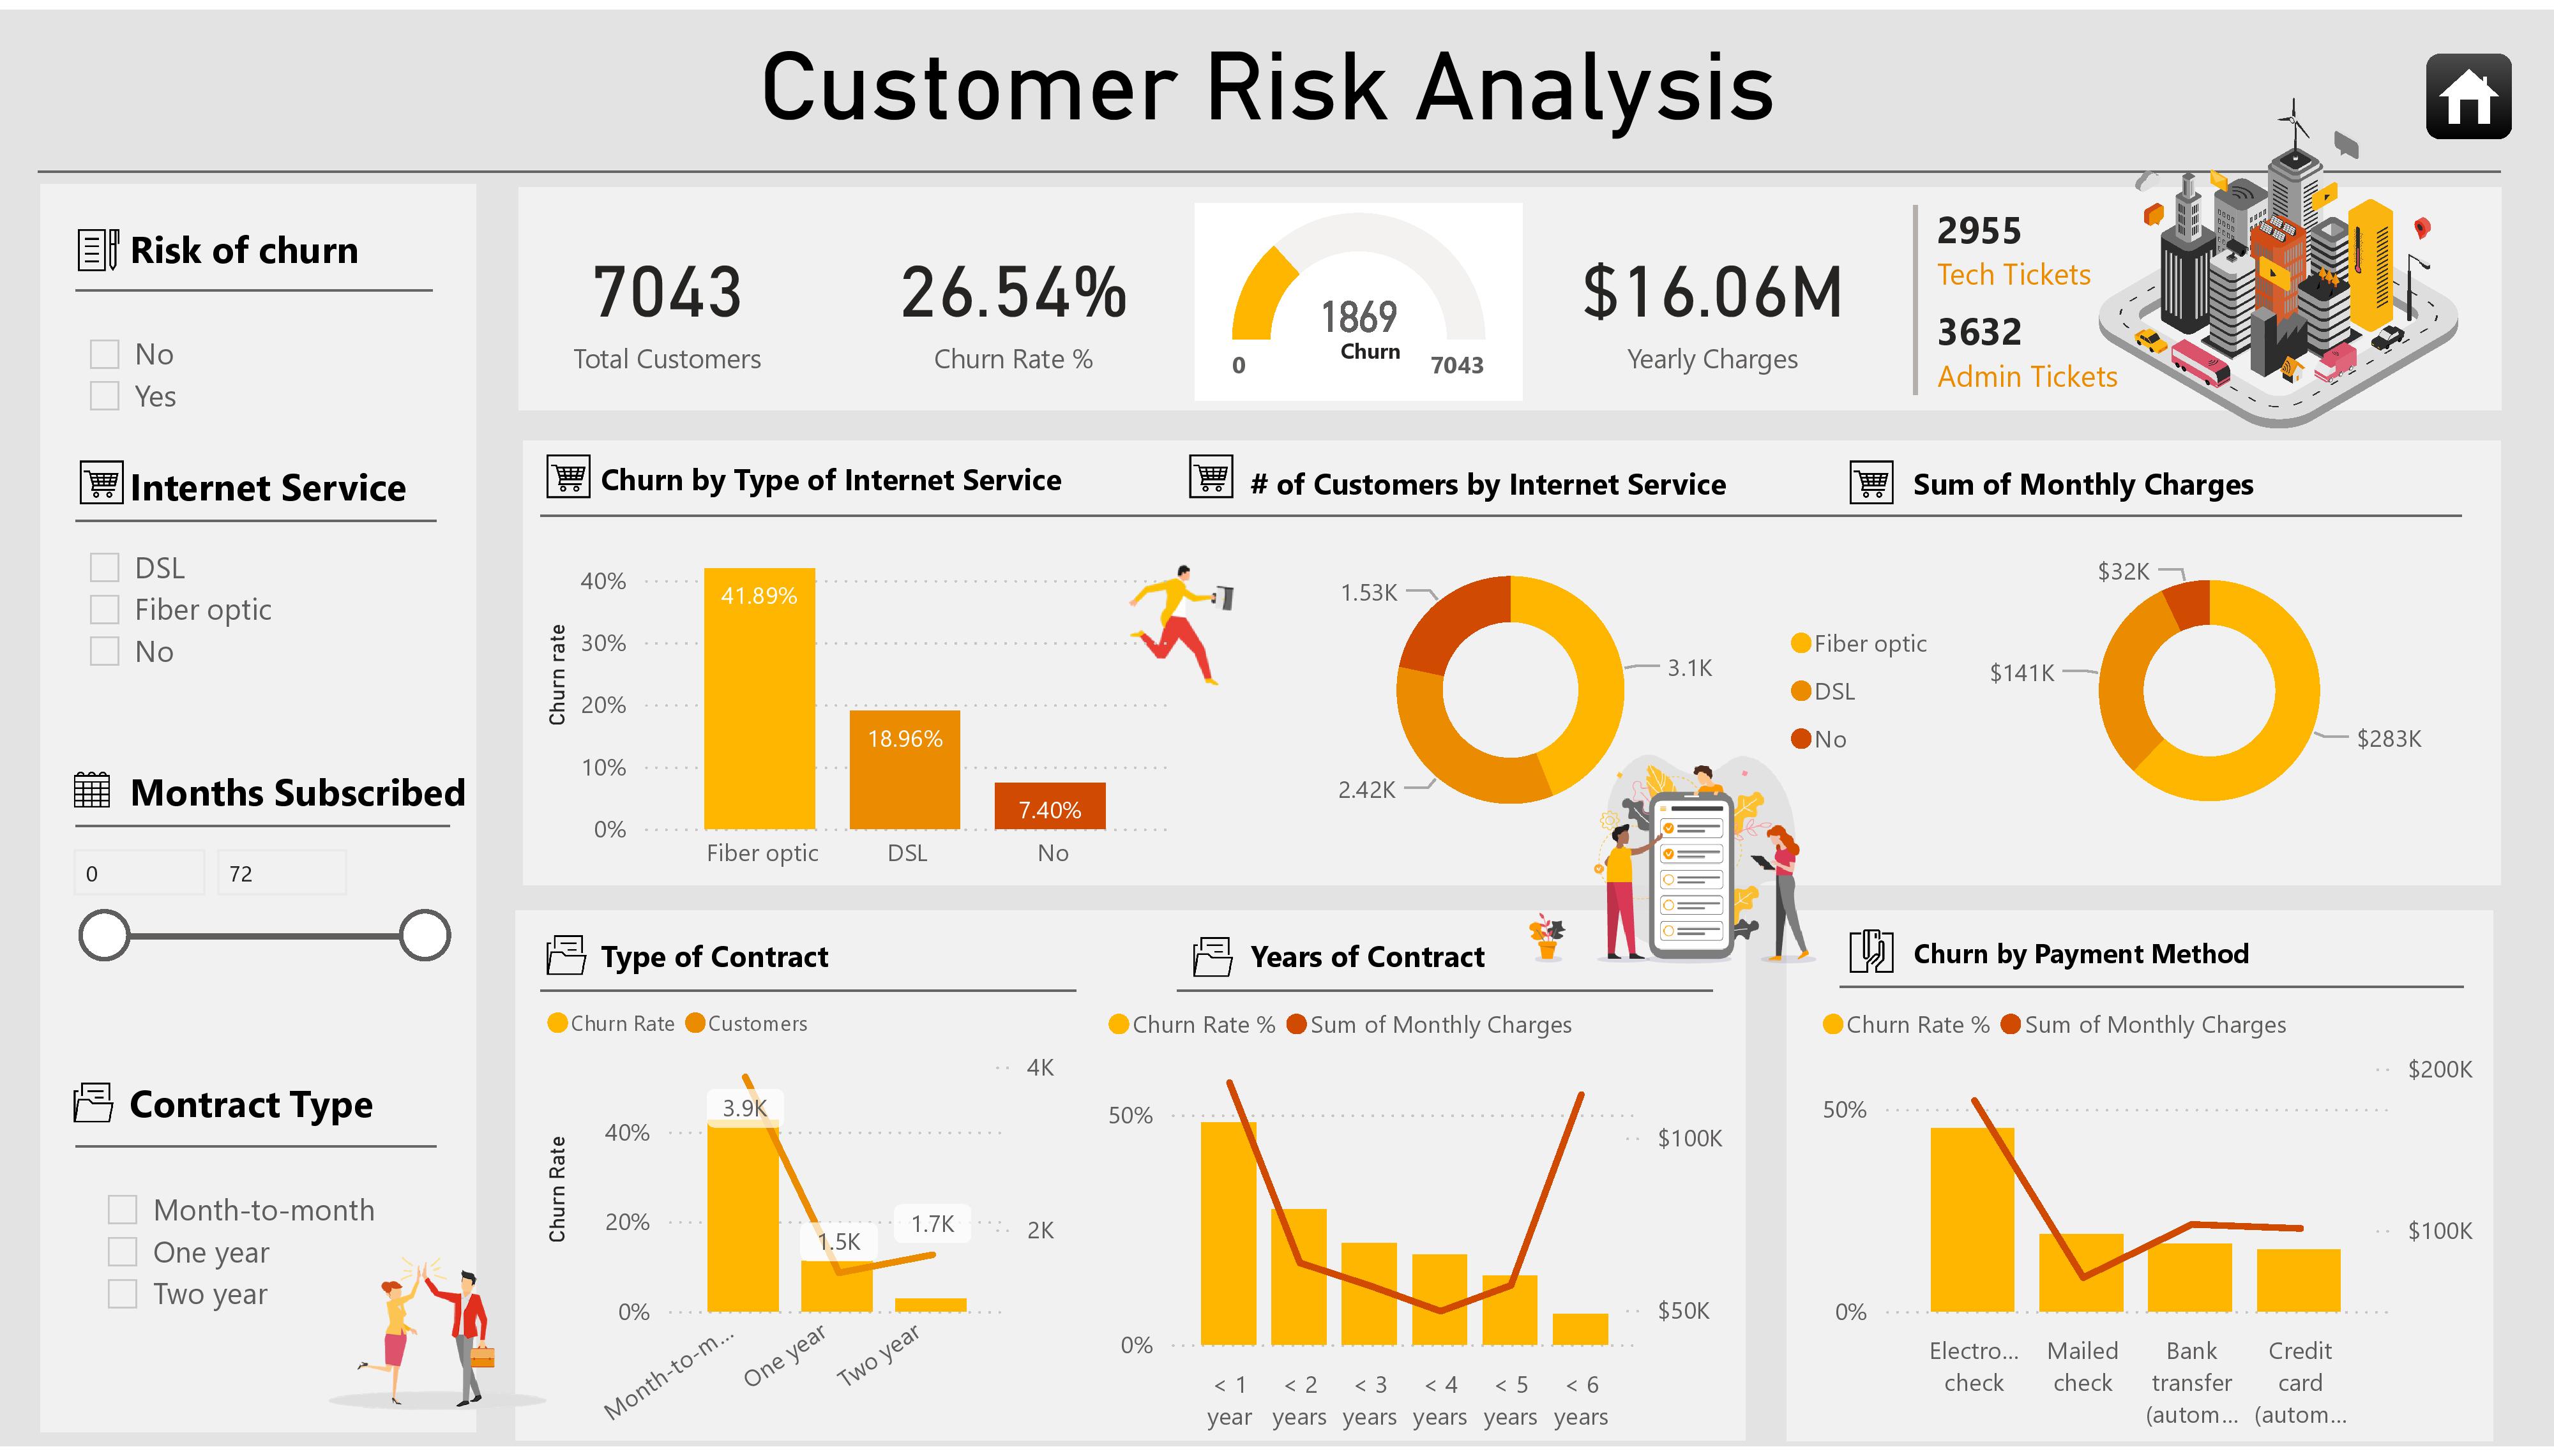
This interactive dashboard provides a comprehensive analysis of customer churn rates in a telecommunications company. It offers valuable insights into the key factors influencing customer churn, allowing stakeholders to understand the underlying patterns and trends in customer behaviour. Through intuitive visualizations and data-driven metrics, the dashboard enables the company to make informed decisions and implement targeted strategies to reduce churn and improve customer retention. By identifying areas of concern and potential opportunities for intervention, this analysis empowers the company to optimize its services, enhance customer satisfaction, and drive long-term business growth.
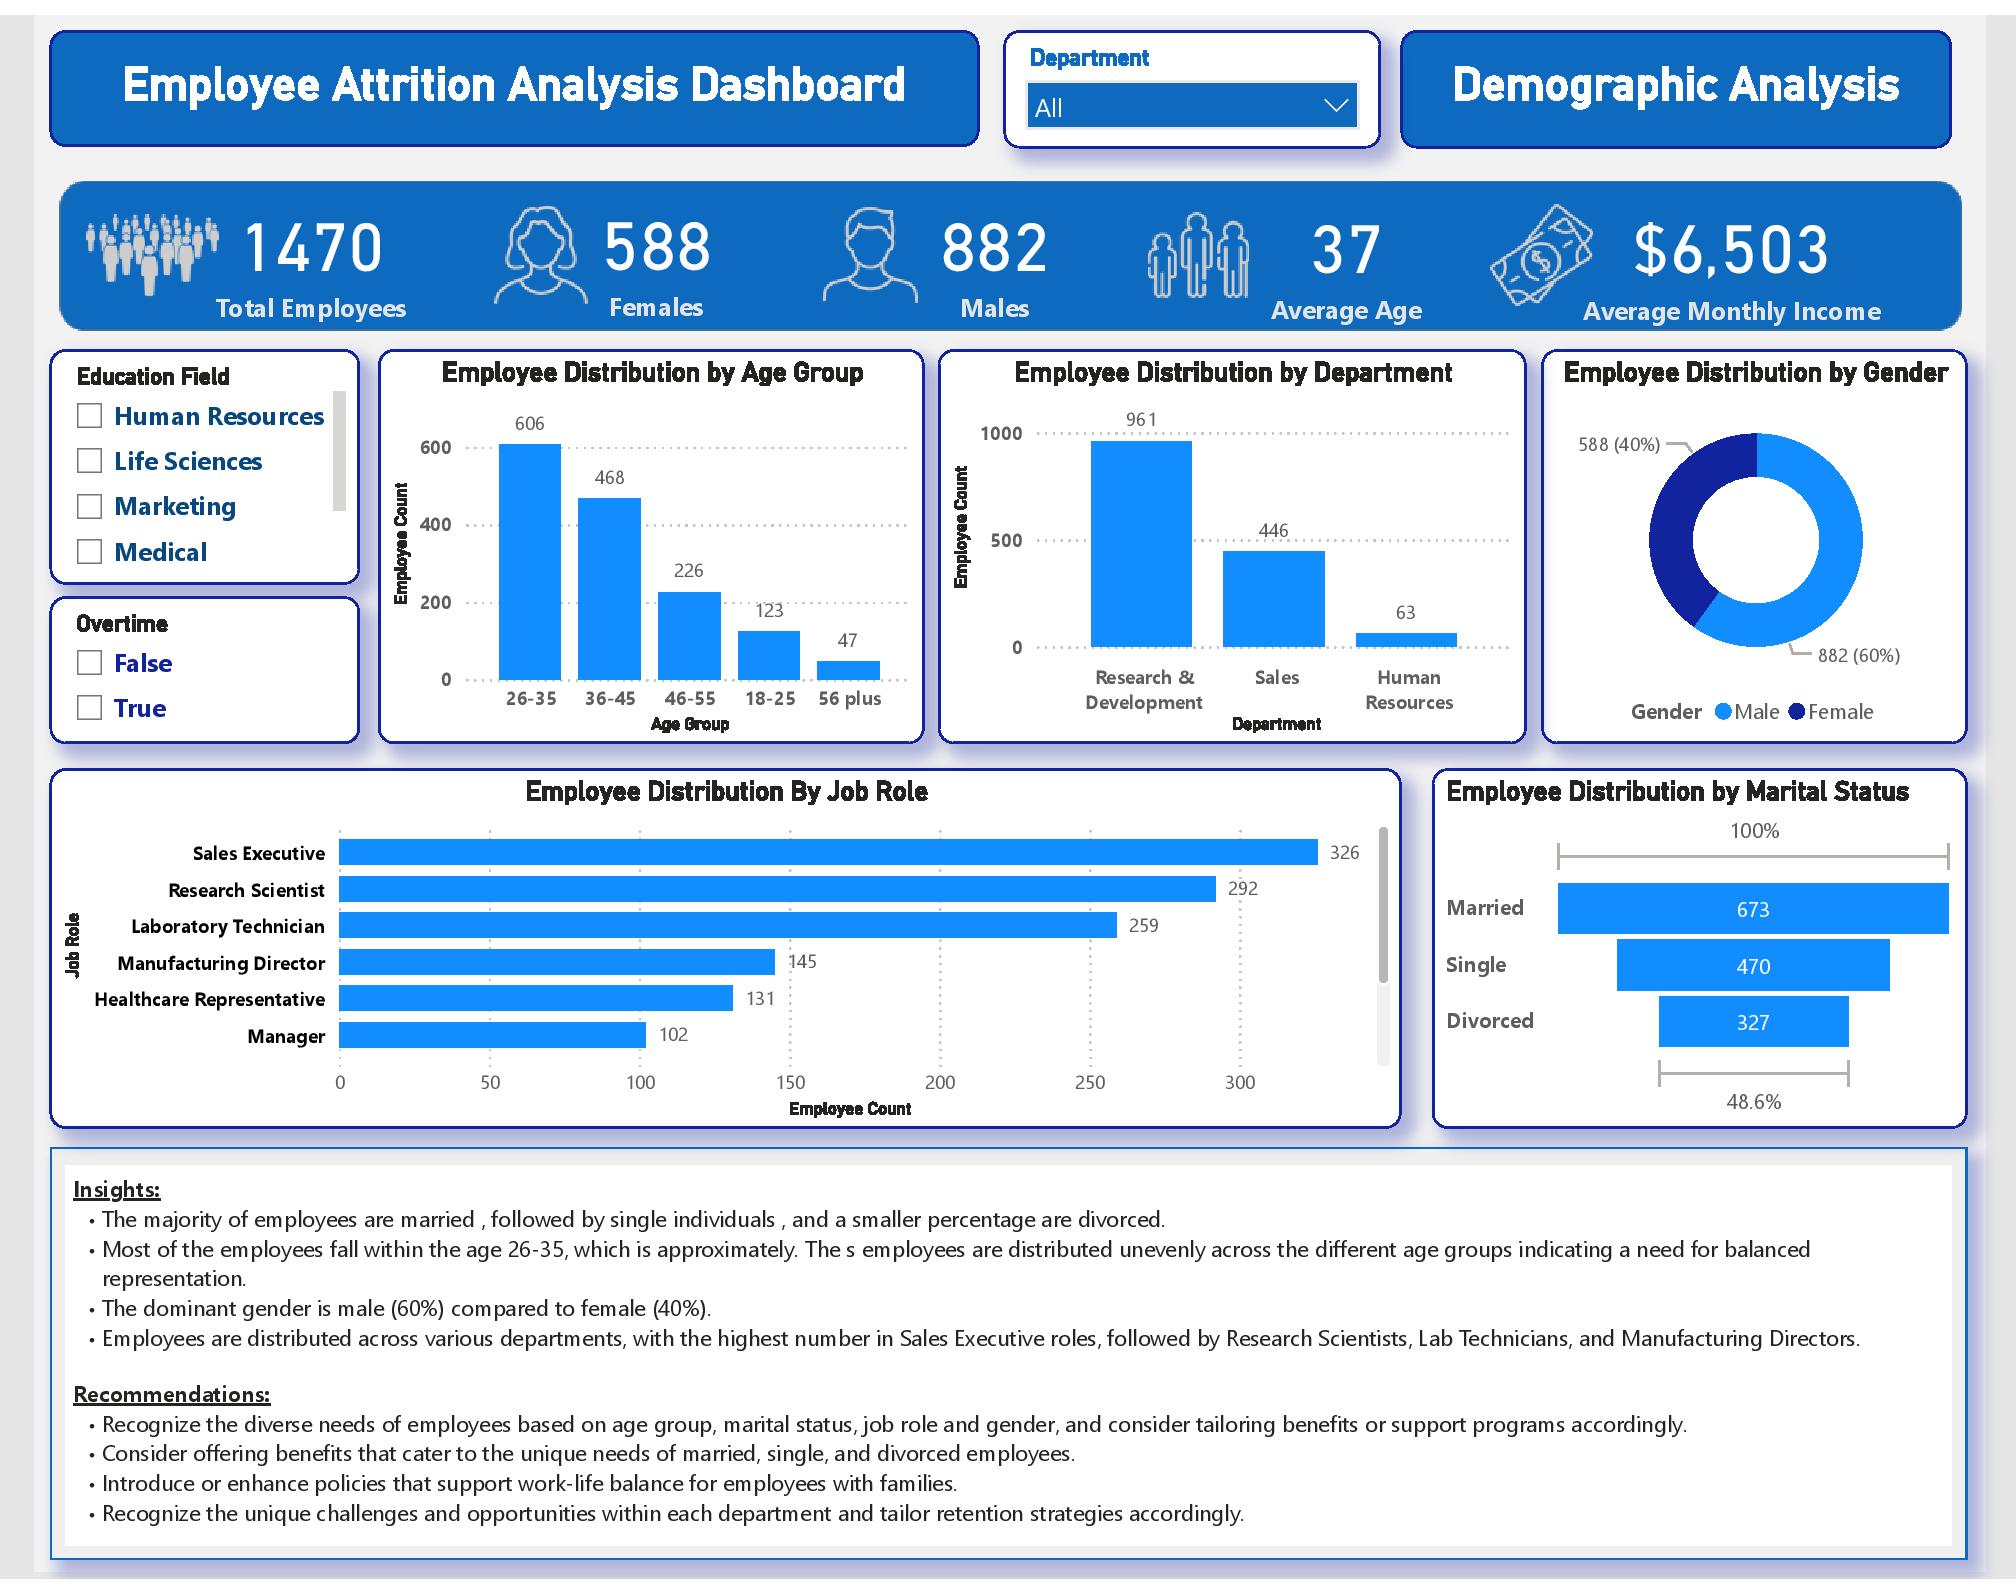
Employee attrition refers to the phenomenon of employees leaving their jobs voluntarily or involuntarily. In this project, I analyzed employee attrition within a remote-first organization using historical HR data. The analysis aimed to identify why employees leave the organization, understand the contributing factors and provide insights to help reduce attrition rates and retain valuable talent. Employee attrition is a critical concern for organizations as it can impact productivity, morale, and overall organizational success. By gathering and cleaning data, leveraging Power BI for data visualization, and conducting statistical analysis, I identified key drivers of attrition, such as low job satisfaction, frequent overtime, and limited career growth. These findings suggest implementing targeted strategies, including improving work-life balance, enhancing career development opportunities, and fostering a positive work culture to mitigate attrition rates and retain valuable talent effectively. Continuously monitoring HR metrics and adapting retention strategies based on data-driven insights will further support organizational effectiveness and employee satisfaction in a remote-first environment.
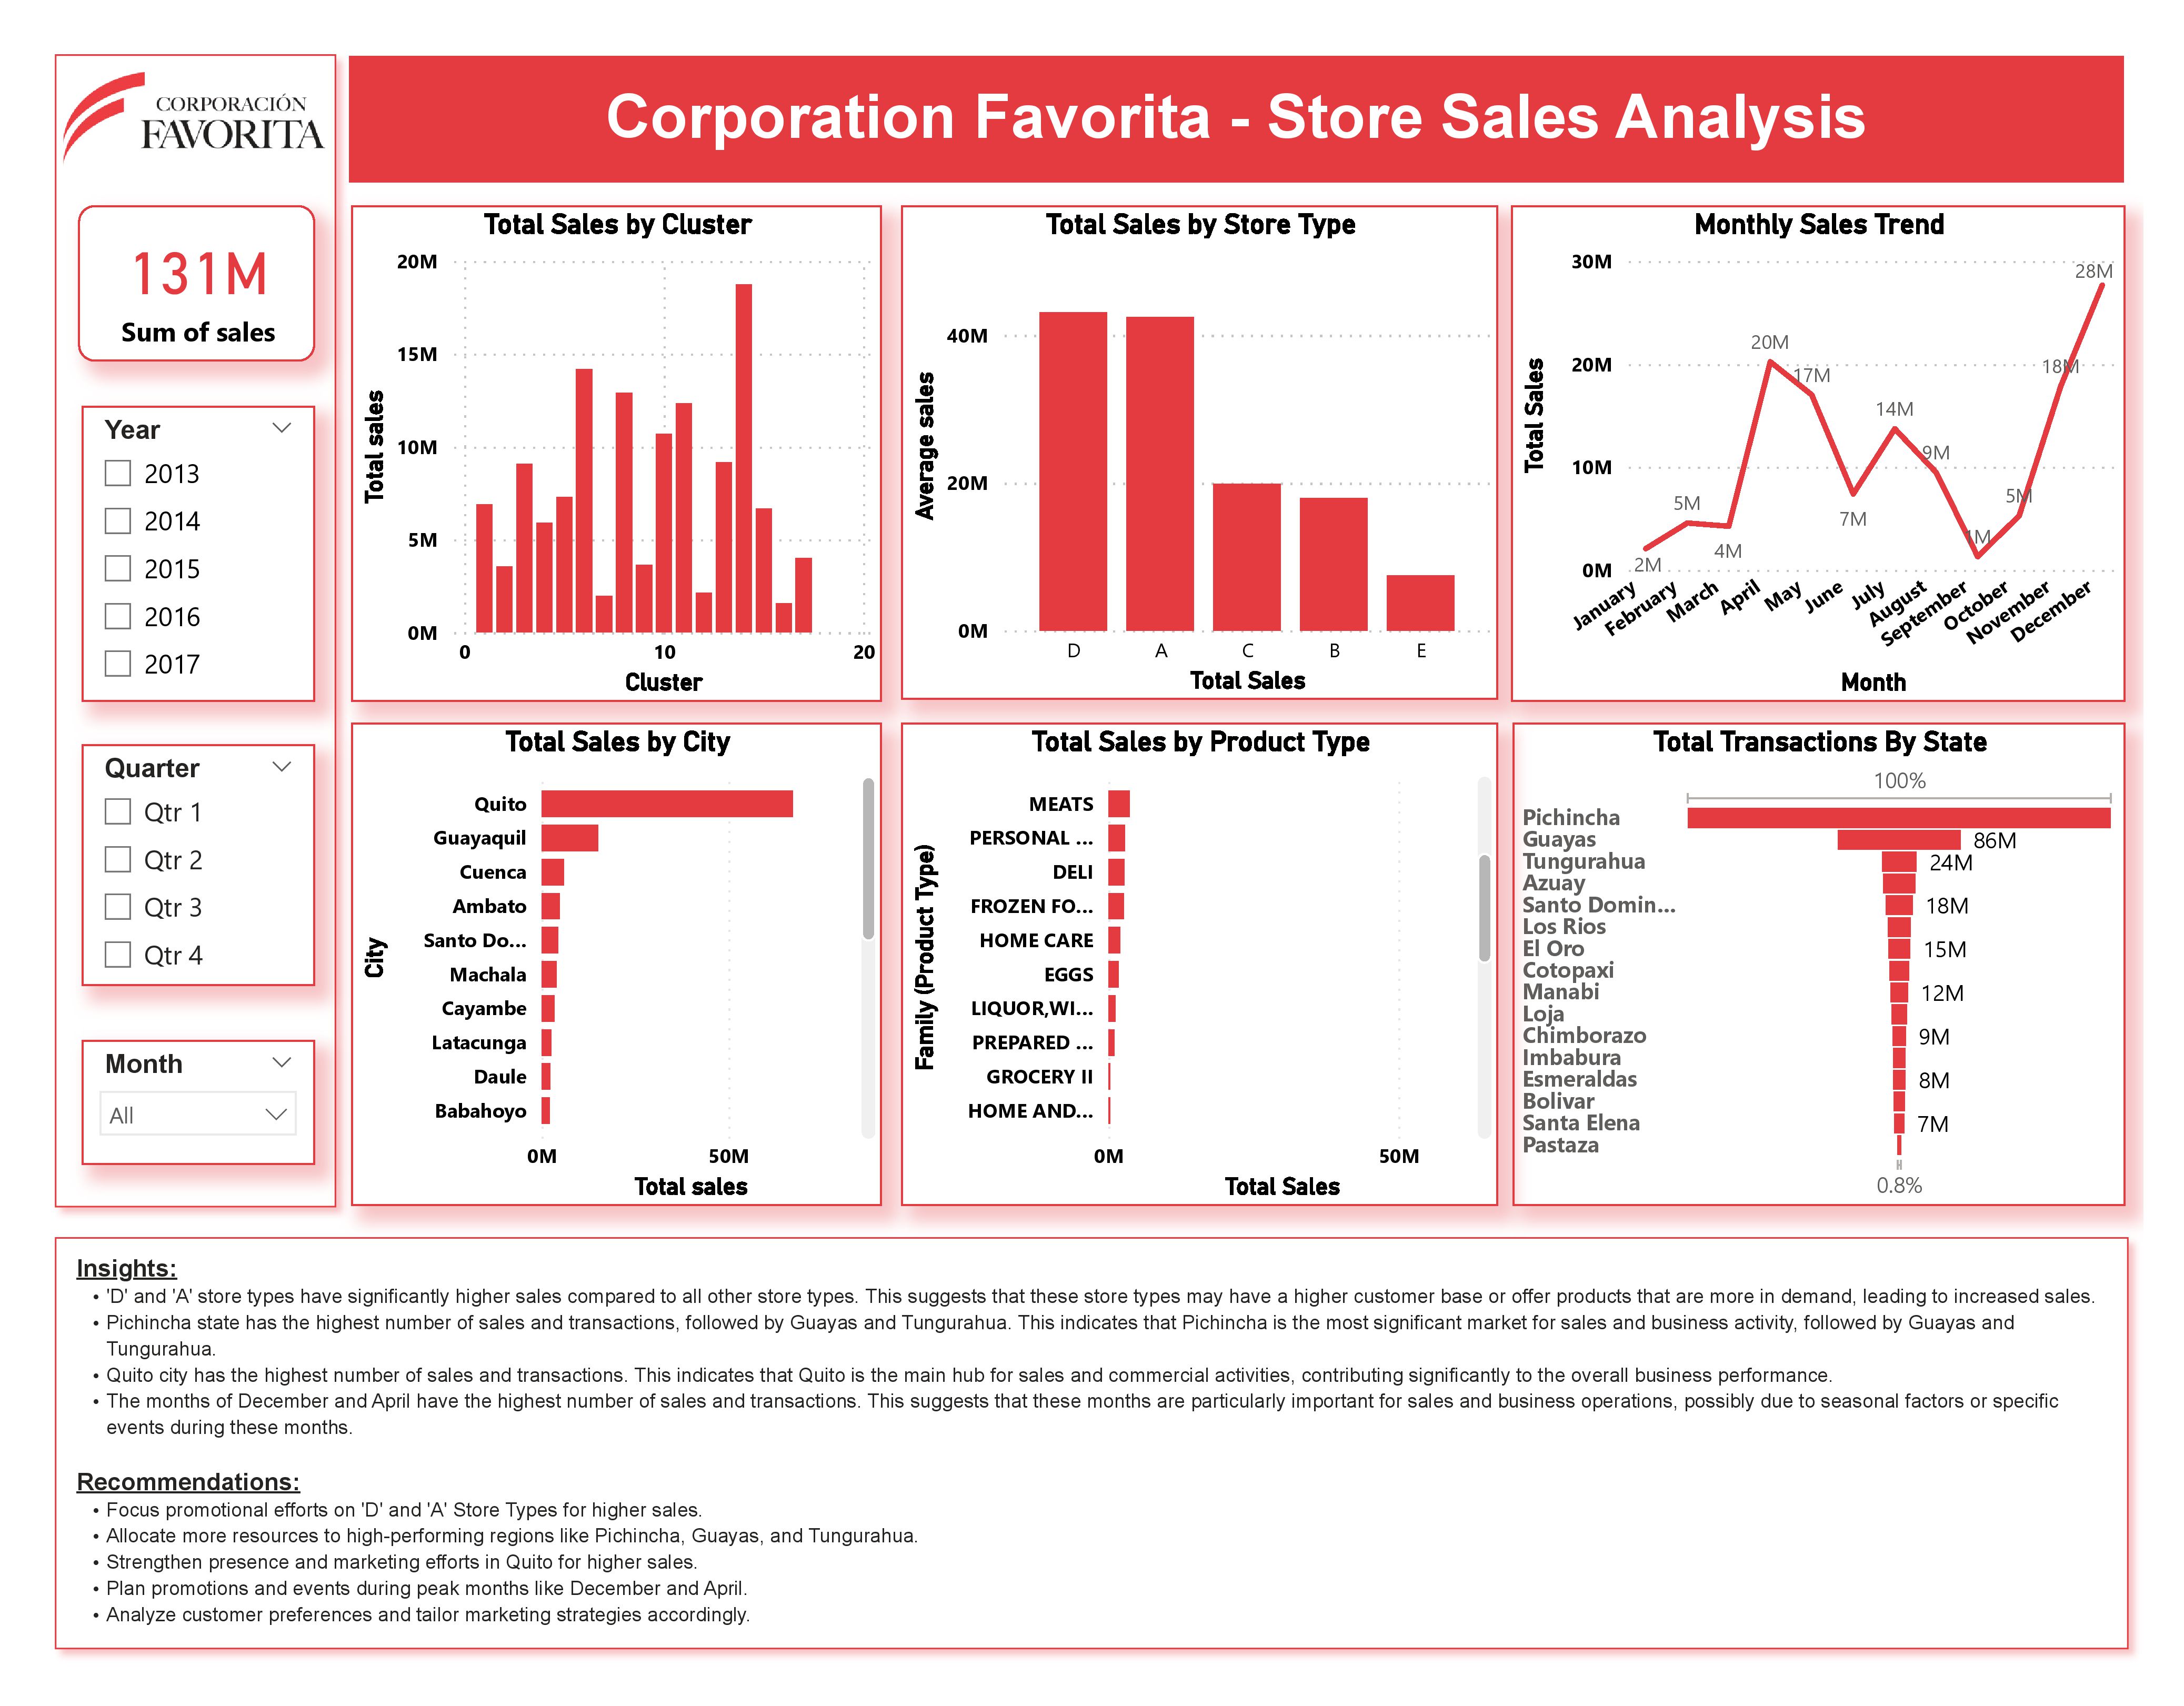
This interactive Power BI dashboard offers a detailed analysis of store sales data for Corporation Favorita, providing management with valuable insights for data-driven decision-making. The dashboard features visualizations and key performance indicators showcasing sales patterns, store performance metrics, and the effects of promotions, holidays, and external factors on sales outcomes. The data analysis within Power BI enables a comprehensive understanding of store sales dynamics and empowers management to optimize strategies based on actionable insights derived from the visualizations and metrics presented in the dashboard.
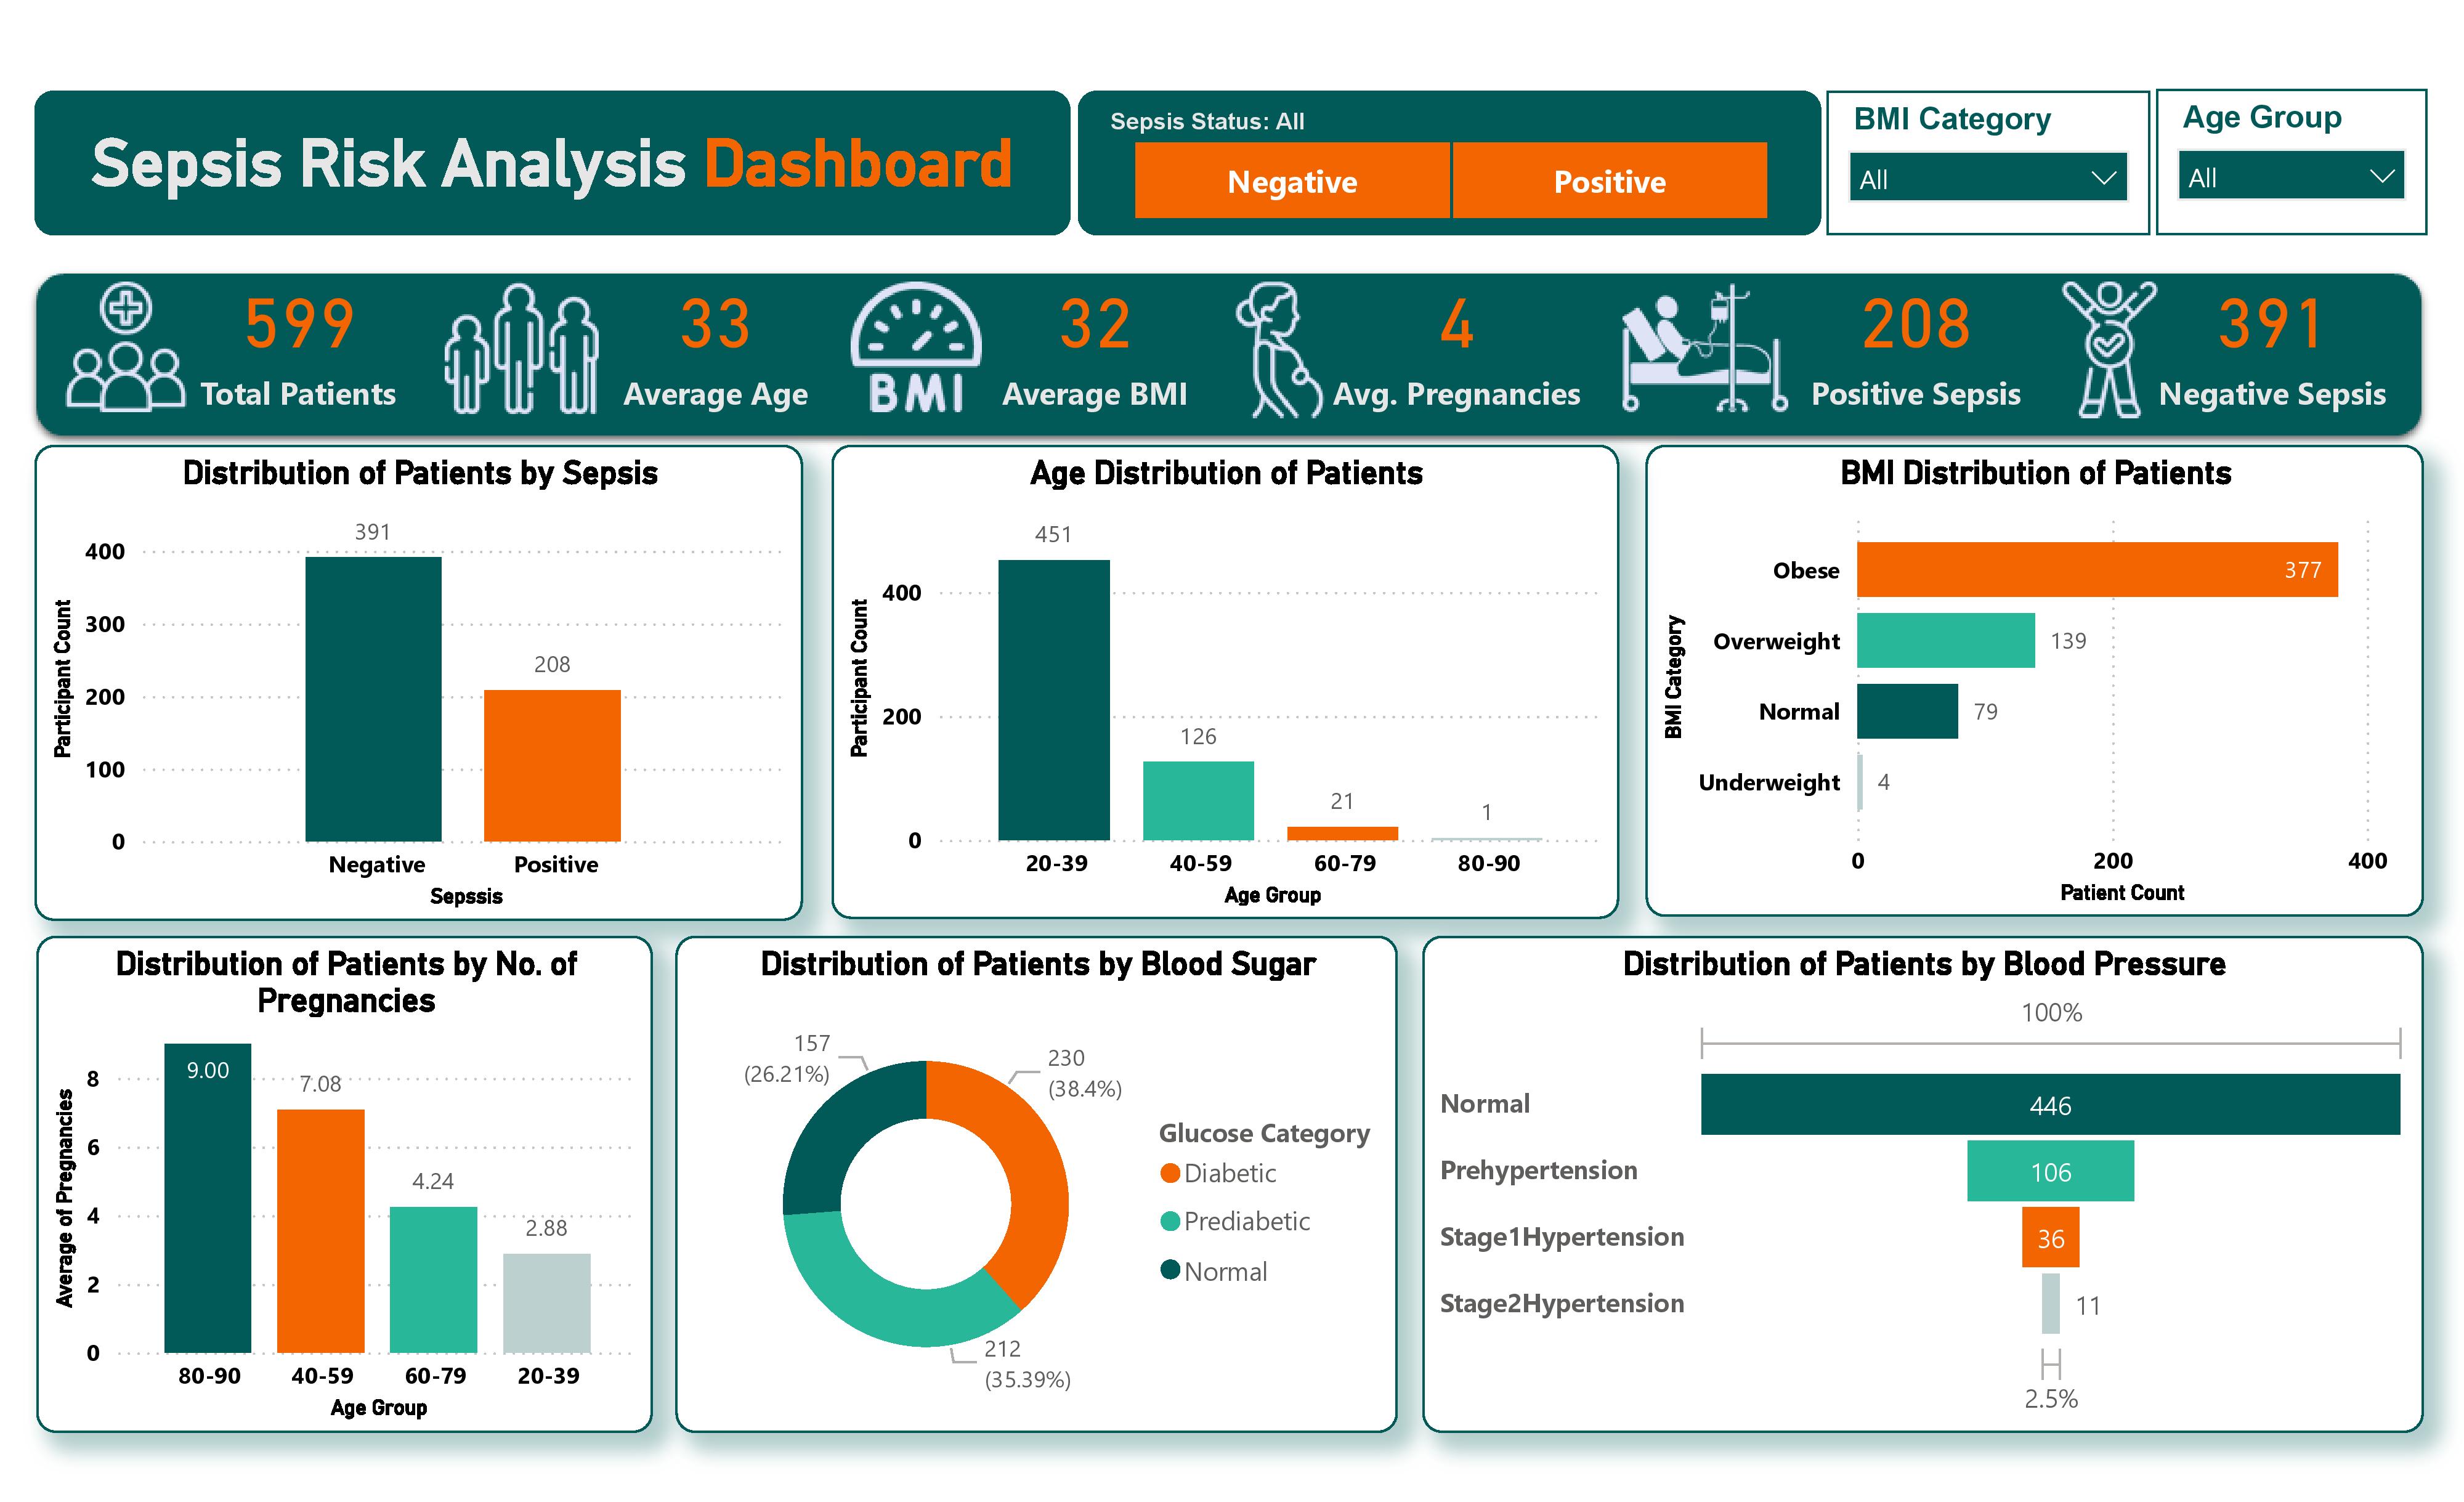
Sepsis is a critical medical condition triggered by the body's extreme response to an infection. It can lead to organ failure and, if not detected early, poses a serious threat to life. This analysis leverages Power BI to explore the relationship between age and various health indicators relevant to sepsis risk assessment and management. Using Power BI's robust visualization capabilities, we visually depict age-related trends in factors such as the number of pregnancies ('PRG'), plasma glucose concentration ('PL'), diastolic blood pressure ('PR'), Body Mass Index ('BMI'), and Diabetes Pedigree Function ('BD2'). Through interactive charts and graphs created within Power BI, we highlight age-dependent variations in these health parameters, providing actionable insights for healthcare professionals to tailor sepsis prevention and management strategies based on specific age groups. This approach demonstrates the power of Power BI in translating complex health data into accessible visualizations that facilitate data-driven decision-making in sepsis care and intervention.
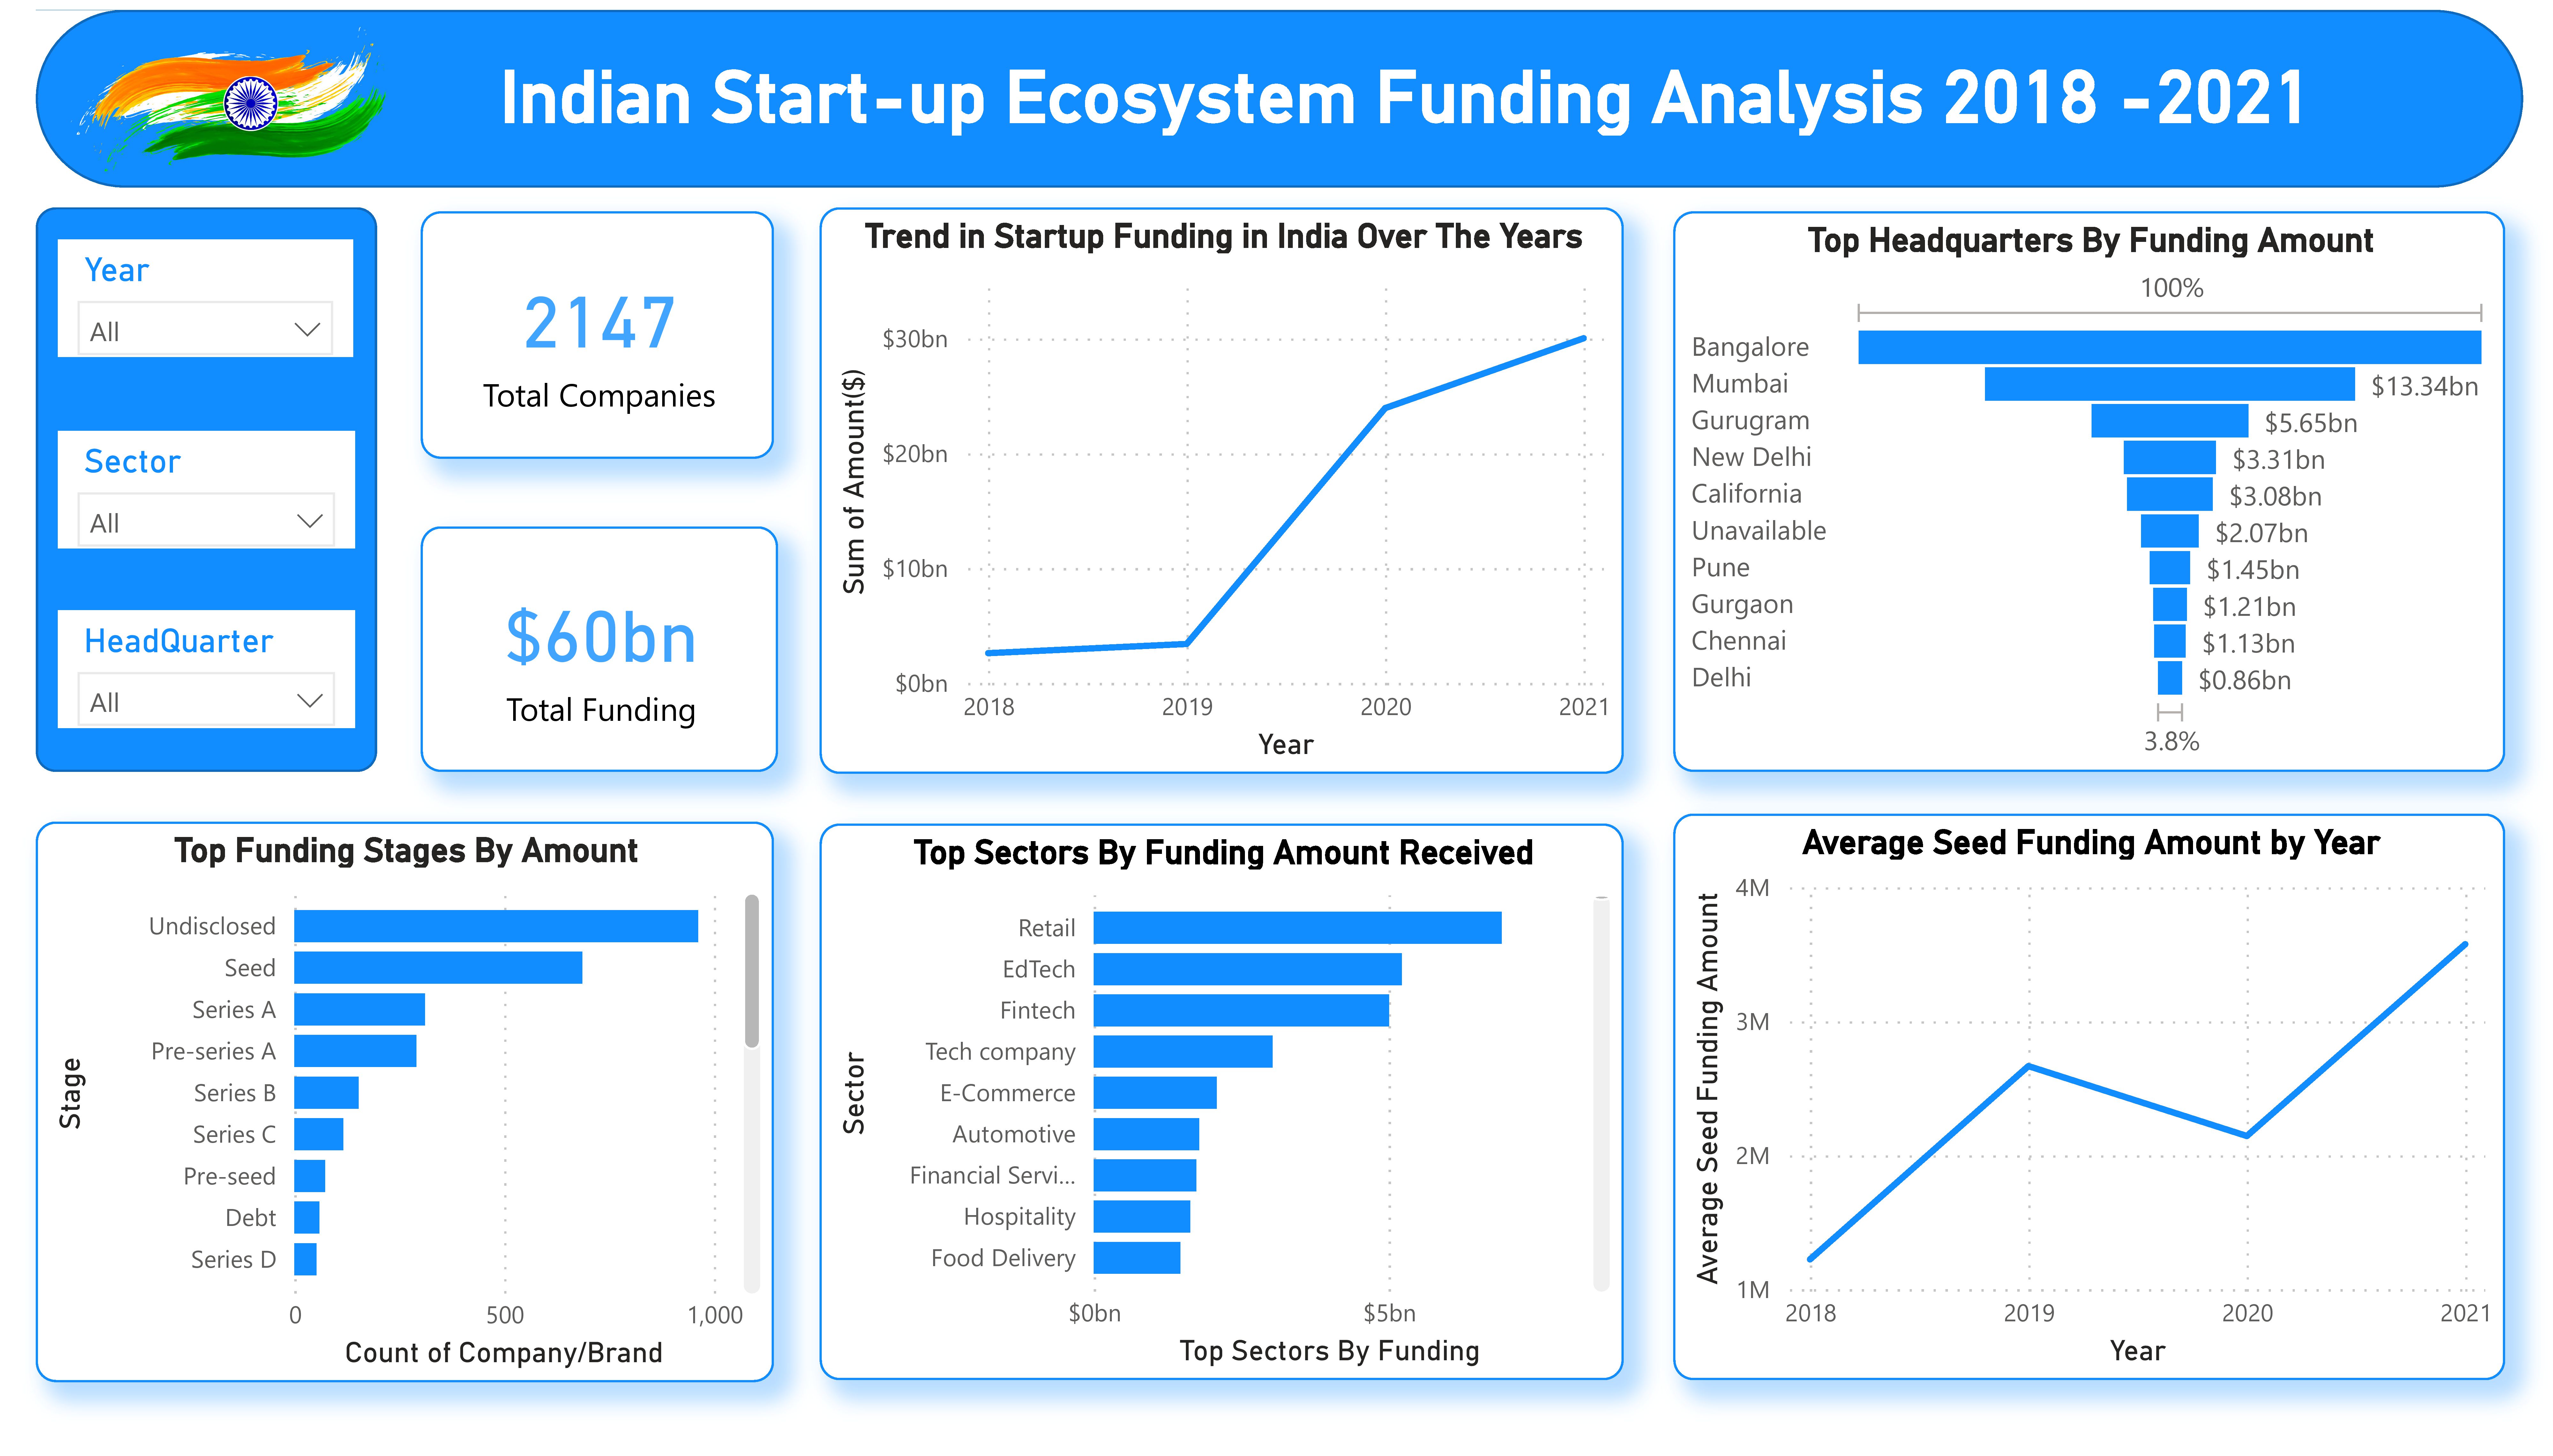
This interactive dashboard provides a comprehensive analysis of the funding trends in the Indian start-up ecosystem over a four-year period. This visualization offers valuable insights into the funding patterns, sector-wise distribution, geographical impact, trends over time, and correlations between different factors.


